2025年4月26日小作文
写作类型:TASK1 出题年份:2025 话题分类:柱图
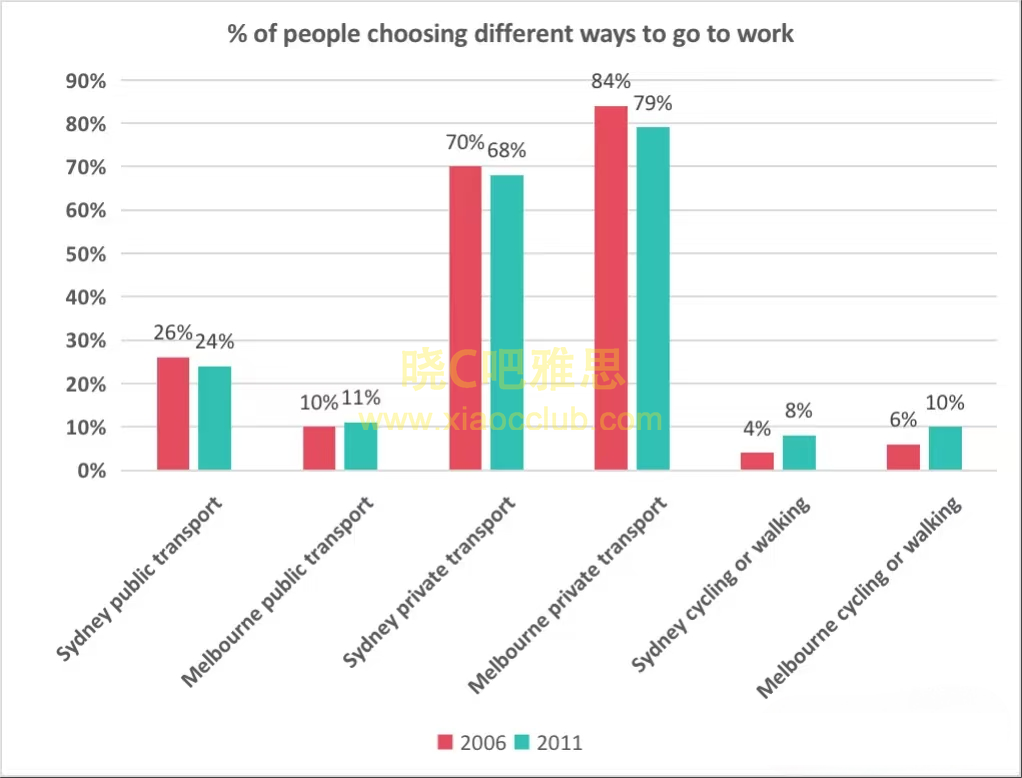
The chart below gives information about the percentage of people in Melbourne and Sydney who used different types of transport to get to work in 2006 and 2011.
The chart below gives information about the percentage of people in Melbourne and Sydney who used different types of transport to get to work in 2006 and 2011.