2025年4月12日小作文
写作类型:TASK1 出题年份:2025 话题分类:柱图
The chart below shows information about fuel used in the transport sector in different countries in Europe, compared to the EU average, in 2009 and 2010.
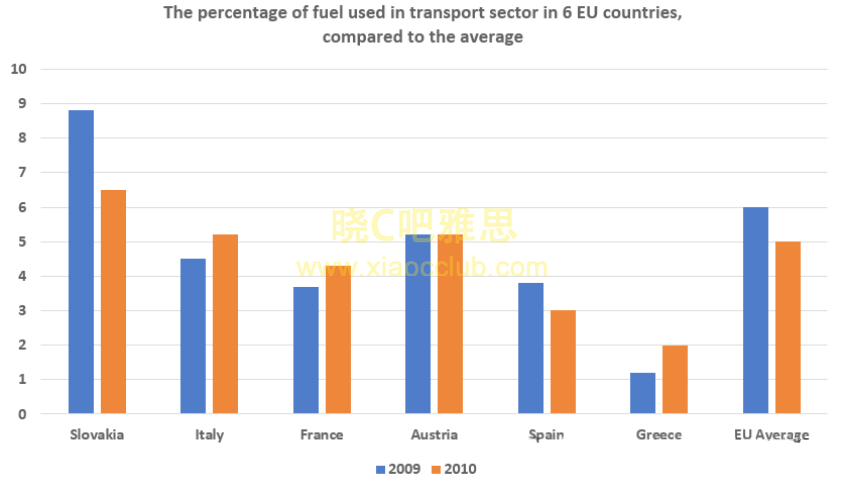
The chart below shows information about fuel used in the transport sector in different countries in Europe, compared to the EU average, in 2009 and 2010.