2025年2月22日小作文
写作类型:TASK1 出题年份:2025 话题分类:线图
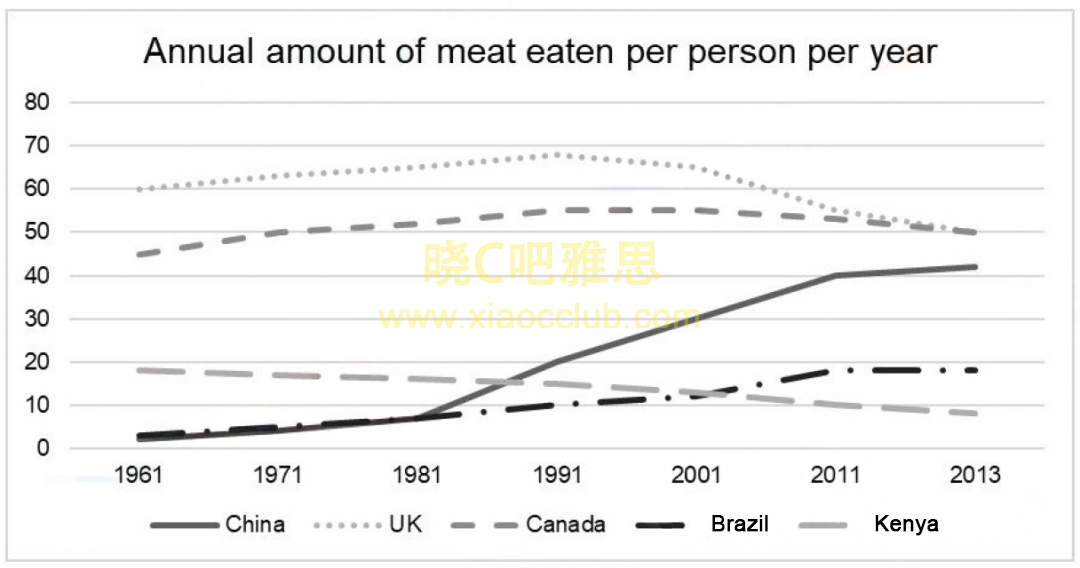
The graph below shows annual amount (kg) of meat eaten by per person per year in five different countries from 1961 to 2013.
没有了
The graph below shows annual amount (kg) of meat eaten by per person per year in five different countries from 1961 to 2013.
没有了