2024年3月2日小作文
写作类型:TASK1 出题年份:2024 话题分类:混合图
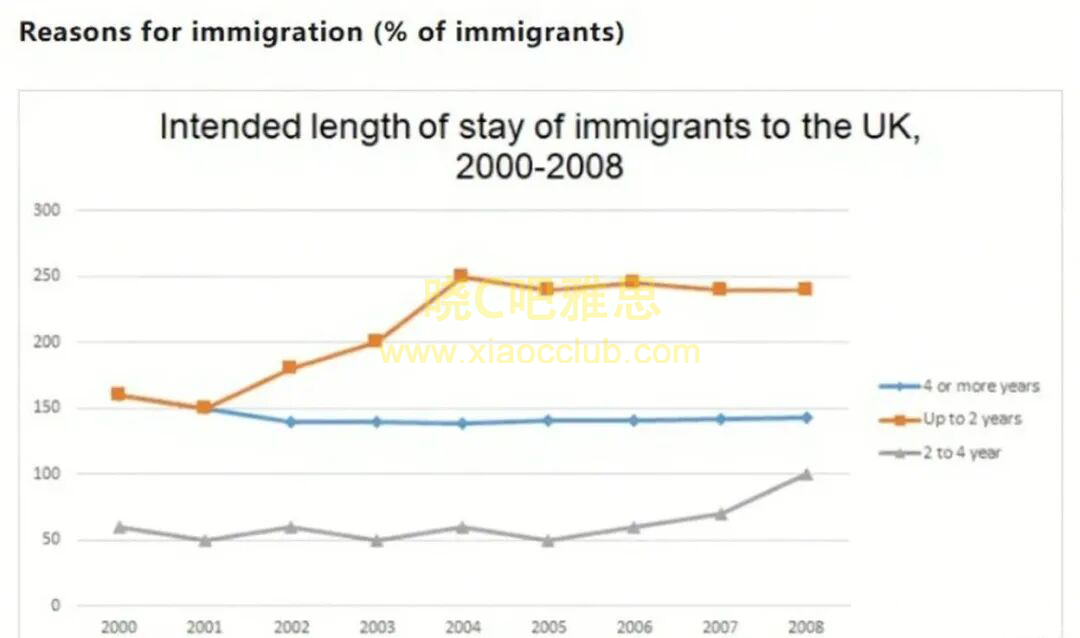
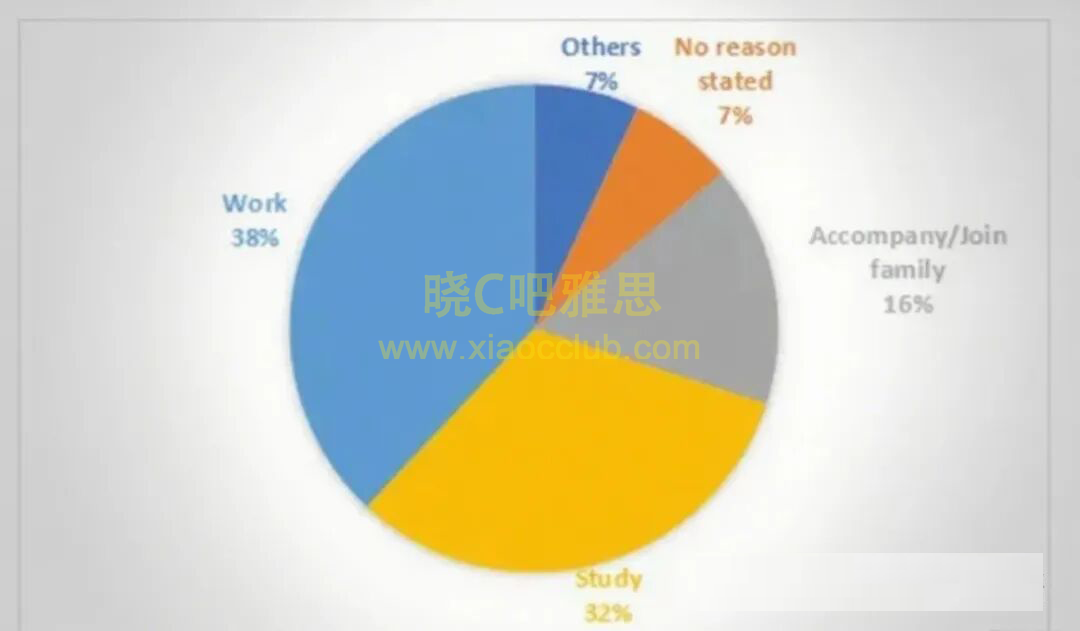
The line graph and pie charts below show the number of three groups of immigrants from 2000 to 2008 and the percentage of immigrants for different reasons in 2008.
没有了
The line graph and pie charts below show the number of three groups of immigrants from 2000 to 2008 and the percentage of immigrants for different reasons in 2008.
没有了