2024年3月16日小作文
写作类型:TASK1 出题年份:2024 话题分类:饼图
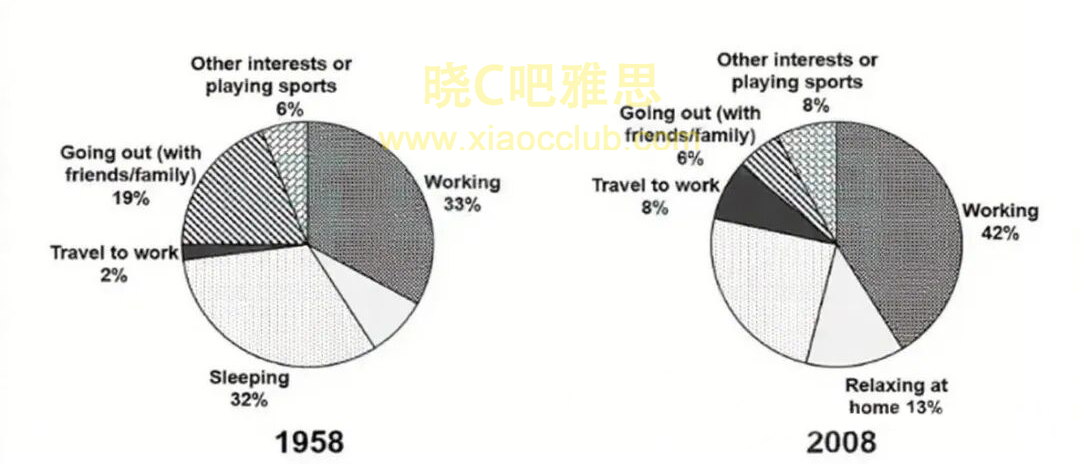
The charts below show the percentage of the day working adults spent doing different activities in a particular country in 1958 and 2008.
Summarize the information by selecting and reporting the main features and make comparisons where relevant.